Team Yankee Analytics V2
By Howard West
On January 22nd, 2021 was published on No Dice No Glory the premise behind the article was the question: can a person who plays a miniatures war game use some basic data collection to keep track of your performance in tournament play and over a time period improve your tournament results based on previous tournament games?
The original article had data from 50 tournament games from the summer of 2018 thru August 2020, V2 adds 34 more tournament games thru August 2021.
So what is new in V2?
When was published on in January 2021, I received quite a few comments and e-mails asking me did I have data on the types of Tank Teams encountered and what types of Air Units where players using. I have added charts for both Tank and Air Units that players used. I also added the new missions from the Team Yankee Extended Missions Matrix that I have played.
So, let’s start with the definition of Analytics.
The Business Dictionary defines Analytics; as the study of past historical data to research potential trends.
What Type of Data has been collected?
I started collecting the data in In July 2018 I entered my new Soviet Army in its first tournament. Before going to that tournament I had played multiple games at our local store with my Soviets but was unsure if my list would work in a tournament. My major concerns were could I get all of my reserves onto the board, did I need Anti Air support, and the various other questions that come up when you enter a tournament with a new army or an existing army.
To answer those types of questions, I started writing down some simple consistent notes about each of my games. The following is what I have collected for each of my Team Yankee tournament games since 2018:
- Date and Location of the tournament
- What was the mission?
- Did I attack or defend?
- What was the opponent’s army’s nationality?
- Did the opponents have Armor ? If yes what types of tank units did they have?
- Did the opponents have air? If yes what types of air unit did they have?
- What was the # of points used?
I also write down a quick note on what they played Ex: American ACR, M-60. That is far as I go on my opponent’s list. I really do not want to dig deeper into their list. For my example, it does not matter if they had 4 M-60s or 12 M-60s in their American ACR List.
Note on the above data collected, in the beginning I was not as consistent as I am today and have a few data gaps in some early games. Like one of my co-workers stated when we where reviewing data at work from one of our consulting projects. “We are not trying to launch the space shuttle with this data, but looking for data trends.”
Point of reference for the charts and graphs that follow are based on the notes that I have collected over the past 84 Team Yankee tournament games. During that time period I used the following armies from July 2018 thru August 2021:
- Various Soviet lists 44(Mainly BMP Infantry and T-62M Tank Battalions or East German Allied Tank Battalions)
- East German lists 24(Mainly BMP Infantry + Soviet Allied T-62M Tank Battalions)
- Americans 16 games(Bradley Mech Infantry Company + various 2nd formation options)
- For a total of 84 games.
I also try to keep a copy of each of the lists that I used for future reference.
What was the mission?
The Chart Below illustrates the % of that Mission types that have been played over the last 84 Team Yankee games. When you compare the current 84 missions that have been played vs the prior publication of you will notice the change in the frequency of the top 5 missions played and that the new Extended missions account for 6% of the total missions that have been played.

Based on the above data, if I wanted to get in any practice games before my next tournament I probably should practice Counter Attack, Rearguard, Free for All, Breakthrough or Encounter. They account for 69% of the games that I have played. This is a -5% change from previous article. Part of this change is probably due to the New Missions that have been added to the Team Yankee Missions Book.
List construction: If you assume that the above mission trend continues, only 15% of the missions had deep reserves. This information may help in future list design. If you use the Extended Battle Plan matrix from the Team Yankee Missions Book you only have 10 mission chances out of 54 total missions in playing deep reserves.
Note: The More Missions Book was used for all of the above games, in all of the recent tournaments the Tournament Organizers (TO’s) have been using the Extended Battle Plans Matrix. In some cases, they may limit the number of Attack, Defend or Maneuver stances for each tournament or may provide the Missions. EX: The TO may limit you to two attack selections. At a recent tournament the TO provided the missions ahead of time, but the players still rolled to determine who the attacker or defender was.
Did I Attack or Defend?
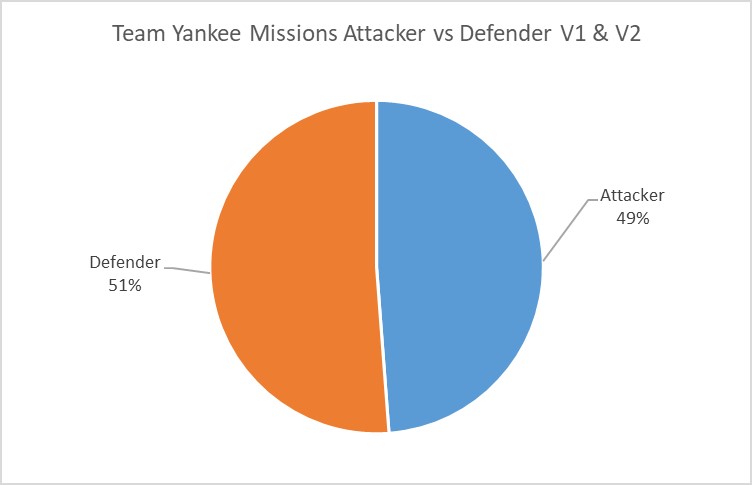
The Chart above illustrates the % of time that I attacked vs Defended. This chart really surprised me that after 84 games I attacked and defended nearly the same number of games. The updated Chart reflects a 3% difference from the original publication. Meaning that I now Defend slightly more than I attack.
With the additional data point of that only 15% of the missions had deep reserves. I may want to consider a more tank heavy force and or transport units with FA greater than or equal to 4. Also over the last 84 games the types of armies I played does effect if I picked Attack, Maneuver or Defend.
After seeing the Attacker/Defender chart, I went back and looked at the raw data again and noticed that I was the net defender in the majority of the meeting type engagements.
Also recently I played in 10 games with the TO mandating Attacker, Maneuver and Defend Stances and out of those 10 games I defended 6 times.
Opponent’s Armies Nationality?

Based on the location of the tournaments that I have entered, the entry still leans very heavily towards NATO. Since my decision to migrate from playing my British army to Soviets in 2018, thru 2021, and East Germans in 2020, 2021. Going forward for the rest of 2021 and 2022 I will be playing a Bradley Company with various different support options and secondary formations. I have faced NATO opponents 72% of the time and Warsaw Pact type opponents 28% of the time. This knowledge has defiantly helped me with list construction. In 2021 I think you might see the above mix change especially with the new West German book being available and the new Warsaw Pact book later in 2021. On the other hand, I have not seen an increase in the percentage of opponents playing British after their new book.
Note on the above chart data: The above data only represents the core formation of my opponents lists and does not account for an Allied formation that might be in my opponents list the in a specific game. EX: US with a West German Ally.
Did the opponent have Air?

The above chart reflects a 9% increase in the number of times that I encountered players having Air units in their lists. This has been a growing trend to see more Air units employed by my opponents in their lists. Air units are one of the potential counters against players using LEO-2, M1-Abrams, Challengers, T-80, and various Spam Armies. I think the percent using air will continue to increase for a while. Also just because they have them on their lists does not mean they ever leave the comforts of their aircraft shelters. In many of the games my opponents Air Units never arrive or make a single appearance.. Going forward my lists will continue having at least two Anti Aircraft Units.
Note: Air is both Airplanes and Attack Helicopters.
Air Units Encountered(New for V2)
The chart below was constructed in response to the several of the comments and suggestions that I received from people reading the January publication of , asking if I had data on the types of Air Units that I encountered.
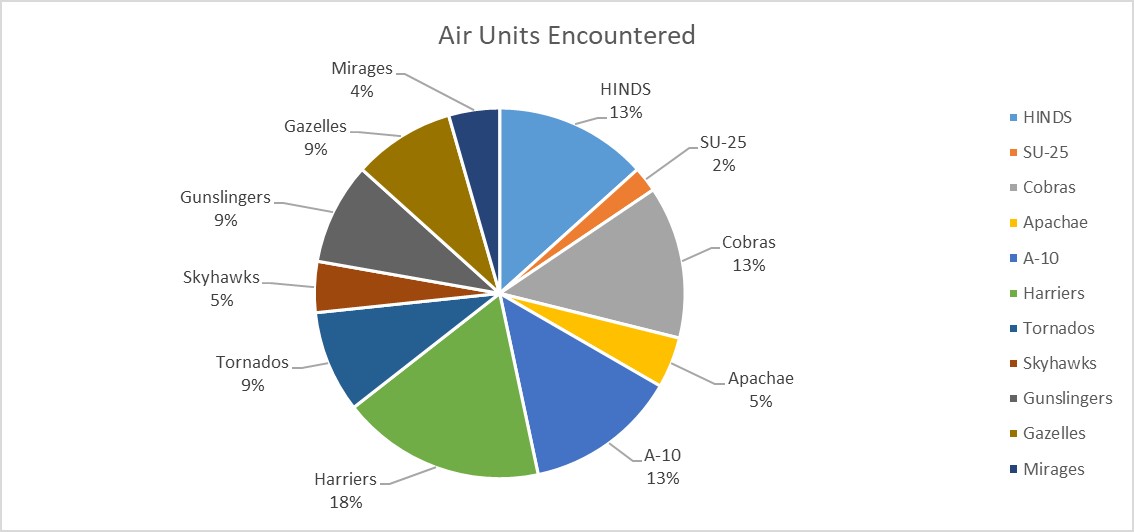
The chart above reflects the 45 different Air Units that I encountered that my opponents had in their lists in the past 84 games. In most cases players had multiple Air Units in their lists. EX: Mirages and Gazelles.
Note on the above data: If a player had three Hind units in their list the above chart would only reflect one encounter, in tournaments that allowed players to have multiple lists or the points varied per round. I only accounted for Air Units that where on the lists that I played against in that tournament.
# of points used for each Tournament?
The chart below reflects the points used for each of the 26 tournaments that generated the 84 Team Yankee Games. Since the original publication of the 105 point, 120 point and variable have been the popular point values used in the tournaments that I have played in.
Note on Variable: Variable means that the TO has set different point values for each of the rounds.

Combined V1 and V2 Tank Units Encountered(New for V2)
The chart below was constructed in response to the several of the comments and suggestions that I received from people reading the January publication of , asking if I had the data on the types of Tank Units that I encountered in my 84 games.
The chart below shows the types of tank units that I have encountered in the the last 84 games. I can use the data from this chart and compare it to the Nations that I have played against and it should help in future list construction or list tweaking. EX: Since I have encountered US lists 33% of the time, I should have lists that can deal with the M1-Abrams that I have encountered 17% of the time. And logically if I can deal with an M1-Abrams I should be able to deal with the US or Israeli M-60’s, you might see a lot more M-60s than you would see a M1 Abrams and you might have to adjust if folks play M-60s in your playing area. US M-60 Marine Tank Companies are a popular option in my playing area.
Chart Note: V1 & V2 means Team Yankee Version V1 & V2

The chart below provides a different look at the same data but based the version of Team Yankee that was used. This is my first stab a sorting out the data based on versions and the effect of the new nation books that have been coming out. The bar chart reflects that actual count vs the pie chart that shows the % of the types encountered vs the other tank units.

Comments on the Tank and Air Chart Data
Just to clarify what you are seeing in the charts, it shows the % of games that I have played that a specific tank shows up. So when you see that I played against M-60 tanks 12% of the time, it does not state how many M-60s. It could be between 1 platoon to several companies on an opponents specific lists. In a specific tournament if I encountered 3 different players playing M-60s then that would be counted as 3 for my data set. This is the same way that I collected the Air Unit data. I also do not differentiate between a Dutch, West German, Canadian or Aussie Leo-1, they are just Leo-1’s for my data collection purposes. The same with M1-Abrams, I did not break down the different M1-Abrams tanks. They are all just Abrams tanks. I did this to simplify the charts. But I do collect it for the different Warsaw Pact type tanks such as the T-72, T-72M, T-62M, T-62, T-55AM and the T-55AM2 since the vehicles have different stats.
In tournaments that players could or had to use multiple lists where each round of the tournament you could have a different point values or could chose between 2 different lists to use. My data only reflects the lists that I played against, not what the player could use in a different round.
Also none of the Tank or Air data accounts for the Tank or Air Units in my armies that I used in the 84 games are represented. I’m concerned that especially the Tank Units that I used might skew the results for tank types, especially the Soviet T-62M and East German T-72 and T-55 might become some of the more commonly used Tank Units. But from my opponents view of the same tournament, that is what their view of the encounters would have my data in it. Something to think about.
Next Steps:
Since after each tournament I update the master Excel spreadsheet, I plan on updating this document after the next 25 to 30+ games have been played. Also, I have been playing around with the idea of opponents played chart mapped to various book releases. I sort of have that with the V1 and V2 combined Tank Unit bar chart that was shown above, but this could be better. I’m also thinking about doing something with the Infantry Fighting Vehicles like the BMP-3, and Marder-2 since they have some tank like stats vs the more traditional Infantry Fighting Vehicles. I have been collecting the BMP-3 and Marder-2 encounters in my data set and might add them into the Tank Charts.
Summary:
Collecting the data and storing it in something like Excel was pretty easy, you do not need to be an Excel guru to build the charts and graphs that I have enclosed. The collected data and the results from the analysis of that data have helped me construct better lists. This same approach could be used for Flames of War.
One thing to remember is that your results will vary based on what your opponents are playing in your geographical area.
Send me your questions or ideas on what you might want to see added.
Good luck with your Team Yankee Analytics, see you in about 25 to 30+ games for V3.
Nice article